
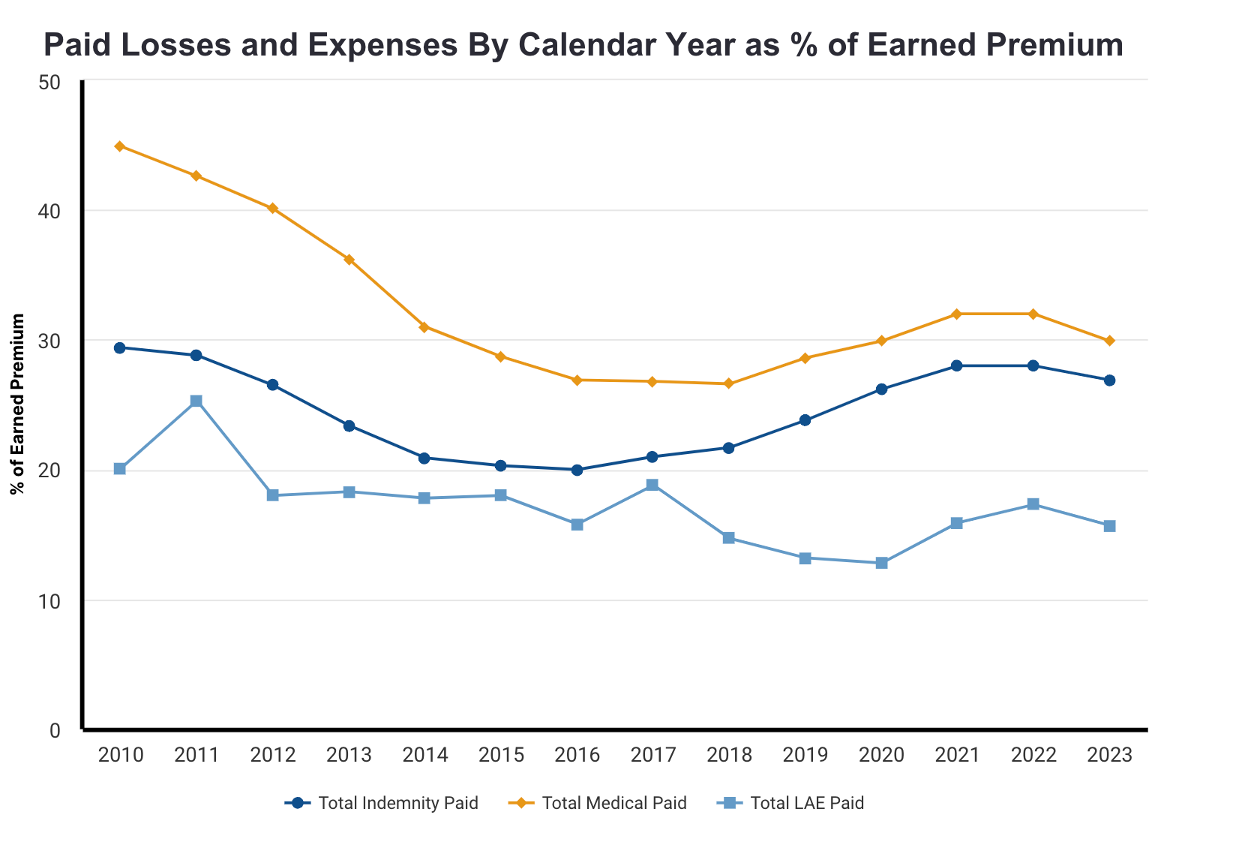
California’s workers’ compensation insurance carriers saw payments for medical benefits tick up 6.8% to $4.7 billion last year, while payments for indemnity benefits climbed 5% to $4.2 billion. Growth in written premium and larger reserve releases, however, more than offset the higher losses.
The total medical and indemnity benefits spending accounted for 56.8% of carriers’ direct earned premium for the year. Expenses added another $5.8 billion to the total, for a loss and expense ratio of 91%. That is a seven-point improvement over the industry’s 2022 calendar year ratio of 98.1% (see chart).
The data is compiled by the Workers’ Compensation Insurance Rating Bureau. Under Insurance Code section 11759.1, the Bureau is mandated to provide an annual report to the Legislature on calendar-year data. The idea is to inform legislators and other policymakers about the state of the California workers’ compensation industry.
However, most legislators and policymakers who lack depth in insurance accounting and look at the report’s bottom line are unaware of the nuances and how the data is skewed. Because of what is both included and excluded from the Bureau’s calculations, the results do not present an accurate view of reality. Usually, it skews the industry’s results to look worse than they are.
The Bureau is a private organization with quasi-governmental responsibility. It is financially supported exclusively by insurance carriers in whose interests it operates.

According to WCIRB’s report, the industry experienced a 2023 pretax underwriting profit of $1.3 billion or 8.5% compared to a $200 million 1.3% underwriting profit last year. Helping boost profitability was a $351 million release of loss reserves when carriers increased reserves by $825 million in 2022.
How it is Skewed
The report does not contemplate:
- Carriers’ returns on investments
- It also excludes the impact of reinsurance, deductible credits, and adjustments for retrospective rating plans.
- Most importantly, in most years, the results are skewed by the intermingling of the private carrier results with those of the State Compensation Insurance Fund, which has underwriting results far worse than the rest of the industry.
- Payments made by the California Insurance Guarantee Association on behalf of failed carriers are included but with no offsetting premium. In other words, the Bureau only includes one side of the balance sheet: CIGA’s payments are excluded from the industry’s underwriting profit calculation but are included in the loss totals, further skewing results.
State Fund’s loss and expense ratios are generally significantly higher than private carriers, but they were less so last year thanks to a $448 million loss reserve release. The State Fund’s year-end report to its board showed a loss ratio of 37.7% compared to its more typical 71.6% loss ratio in 2022. Similarly, the Fund’s loss adjustment expense ratio decreased to 6.3% after a $200 million LAE reserve release. In 2022, its LAE ratio was 25.2%.
It must be noted that State Fund, which has about a 10% market share, intentionally fulfills its mission by underwriting to a loss, generally in the 130s, and making up the difference with investment income.
But when State Fund’s numbers are included in the private industry numbers, they skew the results, usually misleading the Legislature into thinking there is less profitability than really exists in the private market.
Losses
The WCIRB reports that carriers spent $8.9 billion on indemnity and medical benefits in 2022, up from the $8.4 billion they reported spending in 2022.
Of the $4.7 billion spent on medical benefits, the largest component remained direct payments to injured workers at $1.56 billion compared to $1.42 billion in 2022. The direct payments are made as part of settlements to cover future medical care.
Payments for physician services accounted for $1.26 billion, up from the $1.18 billion spent in 2022. Inpatient and outpatient services accounted for $530 million, while med-legal evaluations climbed to $400 million. Medicare-related and medical cost containment payments were the only two categories showing declines. Medicare-related payments dropped to $240 million from $300 million in 2022. Payments for medical cost containment programs dropped $10 million to $110 million last year.
On the indemnity front, carriers paid $4.2 billion in benefits—59% were temporary disability benefits, while 32% were permanent partial disability benefits. Spending on vocational rehabilitation benefits increased 13.8% last year to $82 million. Education-related benefits accounted for 93% of the vocational rehab spending.
Expenses
Expenses dropped slightly from 2022 to $5.8 billion, compared to $5.9 billion the year before. Loss adjustment expenses accounted for nearly $2.5 billion of the total. Allocated loss adjustment expenses were $1.7 billion, while unallocated loss adjustment expenses were $742 million.
Spending on attorneys—defense and applicant’s attorneys—increased to $1.3 billion overall. Defense attorneys earned $938 million last year, and applicant’s attorneys earned $402 million. In 2022, the respective payments were $850 million and $395 million.
Carriers spent nearly $1.4 billion on commissions and brokerage fees, while other acquisition costs amounted to $564 million. General expenses came in at just over $1 billion, and taxes added up to another $347 million. Carriers returned $71 million to policyholders as dividends – 0.5% of their direct earned premium.